

Every dollar sitting on a warehouse rack as slow-moving ceramic is a dollar that cannot pay the next container invoice. For a sanitary ware importer, inventory is typically the largest working-capital line on the balance sheet: order too little and you stock out during the spring build season; order too much and you pay roughly a quarter of the inventory's value every year in storage, interest, breakage, and markdowns.
This article builds an inventory plan for the 2026-2027 buying cycle using one worked example end to end: a North American distributor importing two-piece toilet sets from China. Every formula is shown with concrete numbers - no market forecasts, no industry averages, only arithmetic you can audit.
1. Build the Demand Baseline First
The planning baseline is a 12-month demand history for every SKU you intend to stock. For SKU TP-420, a two-piece toilet set (bowl plus tank), the distributor's last twelve months of sales were:
| Month | Sets Sold | Month | Sets Sold |
|---|---|---|---|
| Jan | 198 | Jul | 176 |
| Feb | 214 | Aug | 202 |
| Mar | 324 | Sep | 238 |
| Apr | 302 | Oct | 252 |
| May | 268 | Nov | 246 |
| Jun | 214 | Dec | 258 |
Annual total: 2,892 sets. Average monthly demand:
MA₁₂ = (D₁ + D₂ + ... + D₁₂) ÷ 12 = 2,892 ÷ 12 = 241 sets/month
Call it 240 sets/month for planning. This single number is the foundation for every calculation that follows. If your sales vary more than ±40% month to month, use 12 months of history rather than 3 or 6 - a short window chases noise and produces stockouts and overstock in alternating quarters.
2. SKU Rationalization: Cut the Tail Before You Buy
The fastest inventory improvement is not a formula - it is removing SKUs that do not earn their rack space. Rank every SKU by 12-month units sold, then divide the list:
| Tier | Share of SKUs | Typical Share of Units | Stocking Policy |
|---|---|---|---|
| A - core sellers | Top 20-25% | 60-70% of units | Full safety stock, container-based ordering |
| B - steady sellers | Middle 40-50% | 25-35% of units | Reduced safety stock, mixed-load containers |
| C - slow movers | Bottom 30-40% | 5-10% of units | Stock 1 unit or drop; special-order only |
The example distributor ran 18 sanitary ware SKUs. The top 4 SKUs produced 58% of all units sold; the bottom 7 SKUs produced 7% of units but occupied 26% of the rack footage. Seven SKUs were cut - five selling under 20 units per year and two color variants selling at less than one per quarter. The line dropped from 18 SKUs to 11.
The immediate effect: every C-tier SKU carried roughly 45 sets on average, or 315 sets across the seven dropped items. At a landed cost of $67.79 per set, that is $21,353 of working capital released.
3. Know Your True Replenishment Lead Time
Your reorder point depends on how long a new order takes to arrive, not on what the supplier's quotation says. Break the total into four components:
| Lead Time Component | Days | Notes |
|---|---|---|
| Supplier production | 42 | Verify against real factory capacity, not brochure claims |
| Ocean transit | 32 | Port-to-port, schedule permitting |
| Clearance and terminal | 6 | Customs, VGM, port release |
| Inland trucking | 2 | Container yard to your warehouse |
| Total replenishment lead time | 82 days | ≈ 2.7 months |
The 42-day production figure deserves scrutiny. A factory that quotes 45 days while running at 95% of real capacity will slip your order - and every slipped week adds to your exposure. Use the method in how to assess a sanitary ware factory's true production capacity to confirm the production window before locking it into your reorder point. Revalidate the total lead time every six months.
4. Safety Stock: The Formula and the Worked Example
Safety stock covers the gap between the demand you planned for and the demand that actually shows up while an order is in transit. The standard formula for a single SKU:
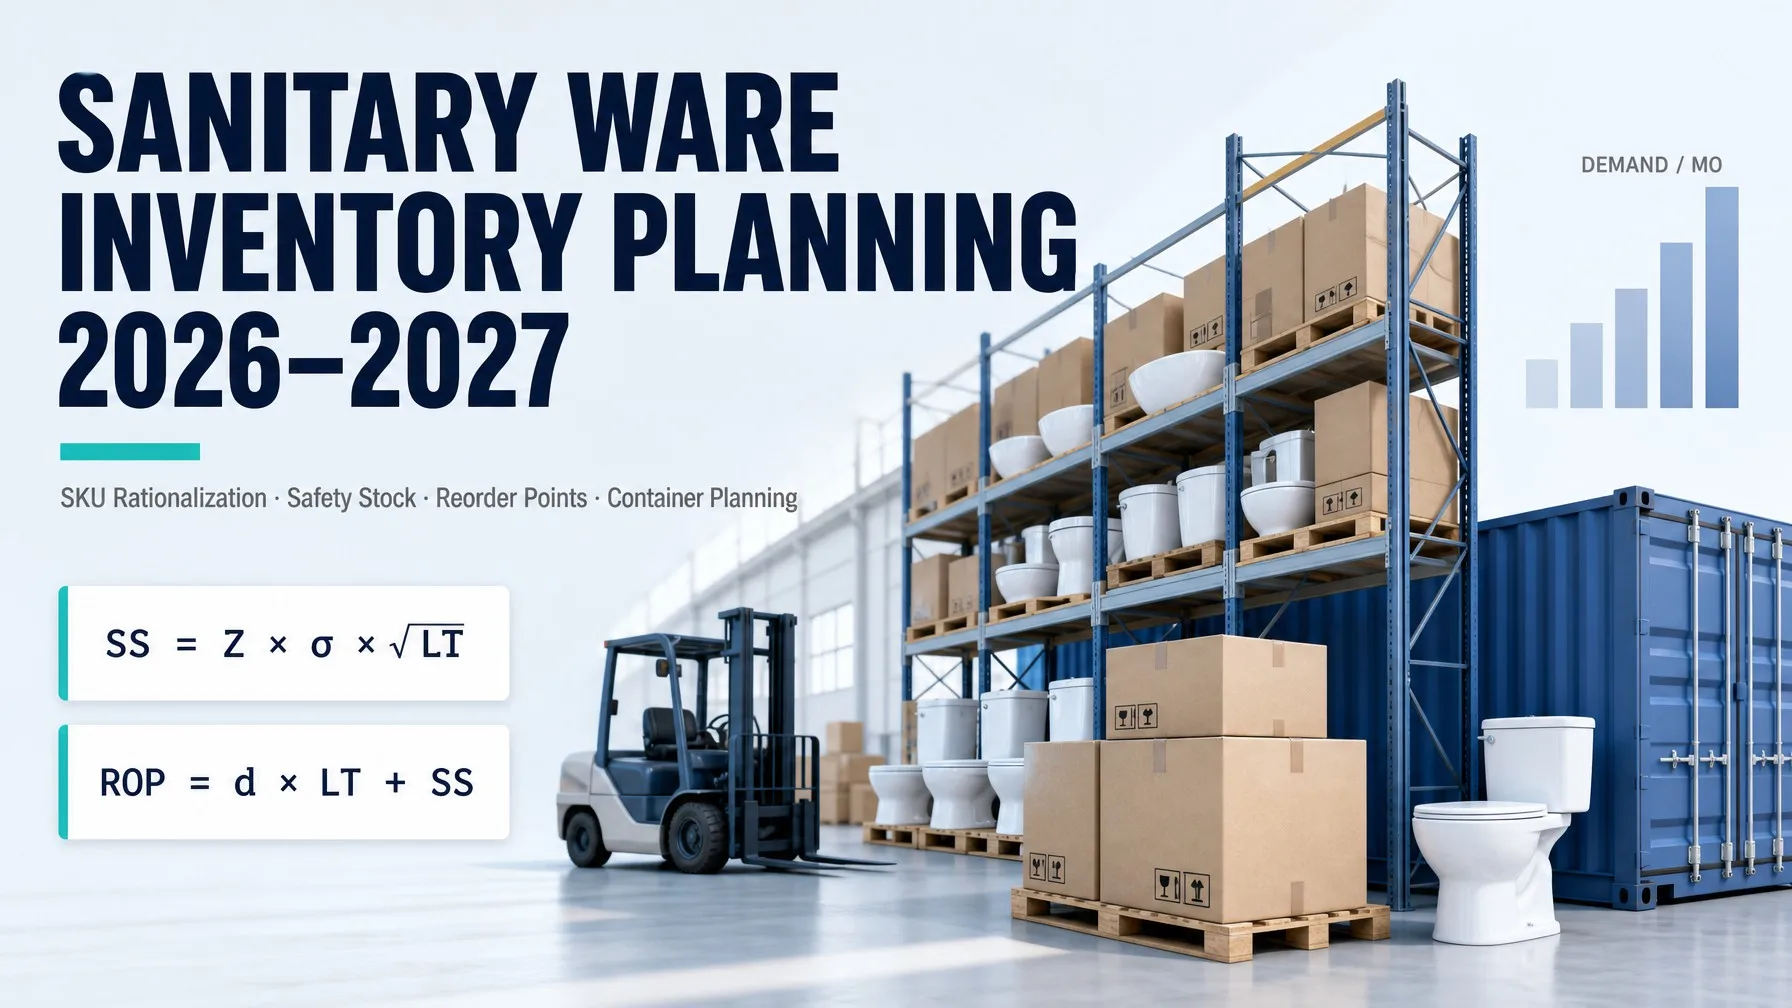
SS = Z × σ_d × √LT
Z = service level factor · σ_d = std. dev. of monthly demand · LT = lead time in months
| Desired Service Level | Z Factor |
|---|---|
| 90% | 1.28 |
| 95% | 1.65 |
| 97.5% | 1.96 |
| 99% | 2.33 |
For TP-420: Z = 1.65 (95% service level), σ_d = 55 sets/month, LT = 2.7 months.
If your supplier's lead time also varies, use the two-uncertainty version: SS = Z × √(LT × σ_d² + d² × σ_LT²), where σ_LT is the standard deviation of lead time in months. For a supplier whose lead time swings between 65 and 100 days (σ_LT ≈ 0.6 months), the two-uncertainty formula gives 1.65 × √(2.7 × 3,025 + 57,600 × 0.36) = 1.65 × 170 = 281 sets - nearly double the simple version. If your lead time is unstable, pay for the more protective formula; it is cheaper than a stockout.
5. Reorder Points That Trigger at the Right Time
The reorder point tells you when to order. It is deliberately separate from how much to order, which the container plan in the next section governs.
ROP = d × LT + SS
ROP = 240 × 2.7 + 150 = 648 + 150 = 798 sets
The operating rule: when on-hand stock + in-transit stock ≤ 798 sets, place the next order. The in-transit term matters - if you count only what is in your warehouse, you will double-order while a container is already on the water. Set the trigger as a system alert, not a calendar reminder, and review it quarterly against the demand baseline.
6. Container Planning: Match the Order Quantity to the Box
Sanitary ware is bought in container lots, so the order quantity should be a multiple of what actually fits in a container. Two-piece toilet sets, floor-loaded, based on carton dimensions and stacking limits from the container loading optimization guide:
| Container | Two-Piece Toilet Sets (Floor-Loaded) | Typical Freight | Freight per Set |
|---|---|---|---|
| 20ft GP | 108-125 (use 120) | ~$1,900 | $15.83 |
| 40ft Standard | 220-240 | ~$3,200 | $14.55 (at 220) |
| 40ft HC | 240-288 | ~$3,800 | $13.19 (at 288) |
The 40ft HC with an optimized carton height (6 layers instead of 5) delivers the lowest freight per set: $3,800 ÷ 288 = $13.19, versus $15.83 on a 20ft - a $2.64 per set difference, or $7,603 of annual freight saving on 2,880 sets.
Containers/year = Annual demand ÷ Sets per container = 2,880 ÷ 288 = 10 × 40ft HC
One 40ft HC arriving roughly every 36 days, against an 82-day replenishment lead time
7. Seasonal Scenarios: Index the Peak, Not the Average
Construction-driven demand peaks in spring, and a plan built on the annual average will stock out in March. Convert each month's sales into a seasonal index:
SI_m = D_m ÷ MA₁₂
March: 324 ÷ 241 = 1.34 · July: 176 ÷ 241 = 0.73
During peak months, the reorder point must be recalculated with the peak demand rate:
The execution difference is a pre-build, not a surprise. Peak-season demand from March through June is 324 + 302 + 268 + 214 = 1,108 sets. Four 40ft HC containers (4 × 288 = 1,152 sets) ordered in early December arrive in late February and clear before the March spike - placed six months before the season because the 82-day lead time leaves no room for last-minute corrections. In the off-peak months (July index 0.73), the reorder point drops to 176 × 2.7 + 150 = 625 sets, letting stock run down before the next seasonal build.
8. Cash Tied in Stock: What the Racks Actually Cost
With order quantity Q = 288 sets and safety stock SS = 150 sets:
Average on-hand = SS + Q ÷ 2 = 150 + 144 = 294 sets
Peak on-hand = SS + Q = 438 sets
At a landed cost of $67.79 per set (FOB-based - see the Incoterms comparison for sanitary ware importers for why the term you buy on changes this number):
| Measure | Sets | Cash Value |
|---|---|---|
| Average on-hand | 294 | $19,930 |
| Peak on-hand | 438 | $29,692 |
| Yearly carrying cost at 25% | - | $4,983 |
The 25% per year carrying figure is the standard planning number: warehousing, insurance, financing, handling, and damage on fragile ceramic add up quickly. Every 100 sets safely removed from the system releases $6,779 of cash and avoids roughly $1,695 of annual carrying cost. The SKU rationalization in Section 2 releases 315 sets - $21,353 of cash and about $5,338 of annual carrying cost. Across the whole line, rationalization plus correct safety stock plus container-sized order quantities typically moves average on-hand stock down 30-40% without changing service levels.
The 2026-2027 Planning Sequence
- Pull 24 months of sales by SKU; calculate 12-month moving averages and seasonal indexes.
- Classify SKUs into A/B/C tiers; cut or special-order the C tail.
- Confirm the four-component replenishment lead time with your supplier; revalidate every six months.
- Compute safety stock and reorder point per A-tier SKU; set system alerts.
- Set order quantities to container multiples; lock freight rates for the contract year.
- Schedule seasonal pre-builds in December-January for February-March arrival.
Inventory planning for sanitary ware is not a forecast exercise - it is a container scheduling exercise with the demand baseline as the input. Run the six formulas above on your own numbers and the 2026-2027 buying plan becomes an arithmetic problem with a checkable answer.
🛡️ Get 2026-2027 Inventory Planning Support
Planning your next buying cycle? Contact Yingjie Bath for safety stock calculations, container loading plans, and bulk pricing matched to your product line.
👉 Request Inventory Planning Support & Container QuoteFrequently Asked Questions
How do I calculate safety stock for sanitary ware?
Use SS = Z × σ_d × √LT. For a 95% service level (Z = 1.65), monthly demand standard deviation of 55 sets, and 2.7 months of lead time: SS = 1.65 × 55 × 1.643 = 149 sets. If lead time also varies, use the two-uncertainty formula SS = Z × √(LT × σ_d² + d² × σ_LT²), which produces a materially higher number.
What is the difference between a reorder point and an order quantity?
The reorder point (ROP = d × LT + SS) is the stock level that triggers a new order - 798 sets in the worked example. The order quantity is how much you order when the trigger fires, and for sanitary ware it should be a container multiple, e.g., 288 sets per 40ft HC. Confusing the two causes either perpetual small shipments with high freight per unit or order sizes that do not fit the container.
How many two-piece toilets fit in a 20ft versus 40ft container?
Floor-loaded: about 108-125 sets in a 20ft GP, 220-240 in a 40ft Standard, and 240-288 in a 40ft HC with an optimized carton height. At 288 sets per 40ft HC with $3,800 freight, the cost is $13.19 per set versus $15.83 per set on a 20ft at 120 sets.
How should seasonal demand change my reorder point?
Recalculate the reorder point with the peak month's demand rate instead of the annual average. For a March index of 1.34: peak ROP = 324 × 2.7 + 150 = 1,025 sets, versus 798 for the average month. Then schedule the pre-build so containers clear customs before the peak month, accounting for the full replenishment lead time.
How much cash does excess sanitary ware inventory tie up?
At a landed cost of $67.79 per set, every 100 sets on the rack represent $6,779 of cash, plus roughly $1,695 per year in carrying cost at 25%. The worked example's 315 sets of removed slow-moving SKUs released $21,353 in cash and avoided about $5,338 in annual carrying cost.